
How to compare a Region sales to the overall sales?
Situation: You want to have a line chart which you can choose one Region and compare to the sum of all regions, across year and customer segment.
How do you achieve the desired result?
I guess there are a lot of ways to do that, but today we are going to use the duplicate datasource approach.
In the follow example, we are going to use Superstore data set.
So, lets start.
Step 1 - Duplicate your data source

Step 2 - Rename the duplicated datasource (optional)

Step 3 - Edit relationships
In our case, we want to see a line per customer segment across the year, filtering a region (on the primary datasource) and comparing to overall regions.
So, we will blend by Order Date and Customer Segment.

Step 4 - Create your viz
We are almost done. Now we will create our viz.
From SuperStore datasource:
4.a Drag&Drop "Customer Segment" to Colors
4.b Drag&Drop Order Date to Columns
4.c Drag&Drop Sales to Rows
You will have something like this:

Step 6 - Include the overall Sales
Now we will include the overall Sales per Customer Segment per Year.
From the Overall datasource:
6.a Make sure the links are in use
6.b Drag&Drop Sales to Rows

Step 7 - Finish
7.a Change the secondary Sales to Dual Axis and then Synchronize the Axis.

7.b Change the size of the secondary Sales

7.c Add transparency to the secondary Sales

7.d remove "Measuare Names" from Color.

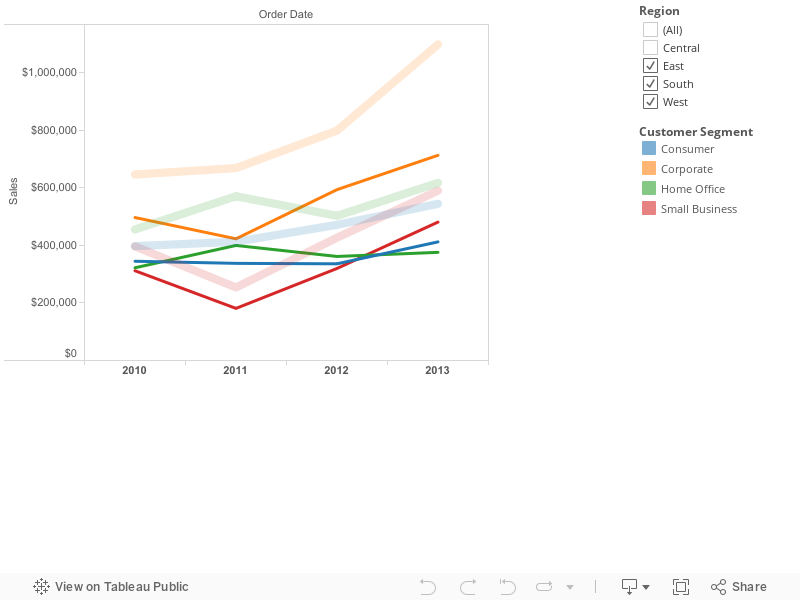
Now you can filter any field from the primary datasource and compare to the overall.
Live version:
Live version:
Nenhum comentário:
Postar um comentário